
BIKE SALES DASHBOARD
An interactive Excel dashboard analysing bike purchase behaviour across customer demographics and key purchasing factors.
PROJECT OVERVIEW
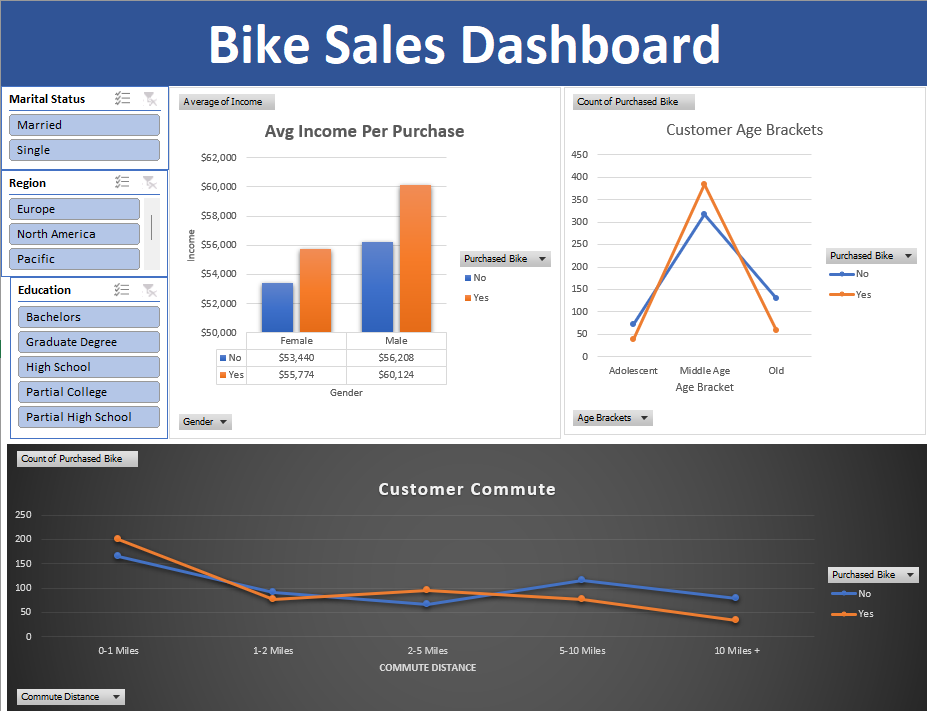
This project uses Microsoft Excel to analyse bike purchase behaviour across customer demographics. The dashboard transforms the underlying dataset into interactive visual insights using Pivot Tables, Slicers and dashboard visualizations.
KEY ANALYSIS
The analysis focuses on the relationship between income and purchase likelihood by gender, purchasing behaviour across different age brackets, and the impact of commute distance on bike purchase decisions.
TOOLS & TECHNOLOGIES
Microsoft Excel | Pivot Tables | Slicers | Interactive Dashboard Design
KEY INSIGHTS
- Analysed income versus bike purchase likelihood across gender groups.
- Compared bike purchasing behaviour across Adolescent, Middle Age and Old age brackets.
- Examined the relationship between commute distance and bike purchase decisions.
DASHBOARD OVERVIEW
The interactive dashboard allows users to explore purchasing patterns across customer demographics and filter the analysis using Excel Slicers.
PROJECT REPOSITORY
The complete Excel workbook, dataset and dashboard preview are available on GitHub.