
MANUFACTURING SUPPLY CHAIN ANALYSIS
A cross-department analysis of six months of purchase, store inventory and sales data from a wear-parts foundry, tracing how problems in one department turned into costs in another.
PROJECT OVERVIEW
The foundry keeps three separate records: purchase orders, a store inventory ledger and customer sales orders. Each department looks only at its own sheet. I audited all three for data quality, then joined them in SQL to find problems that no single department can see on its own. The data covers 131 purchase orders, 1,201 ledger transactions and 407 sales orders from January to June 2026.
KEY FINDINGS
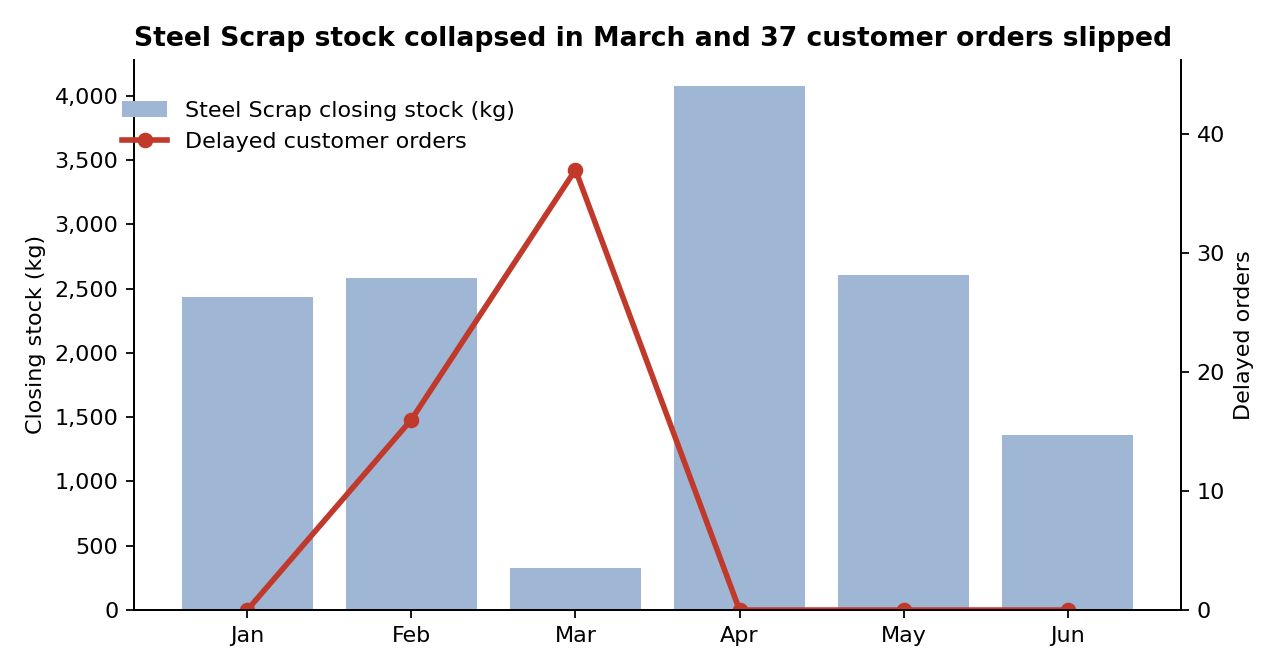
One vendor's delays became 53 late customer orders. Four purchase orders from a single vendor arrived 22 to 27 days late. Steel Scrap stock fell from 2,585 kg to 324 kg, and 53 customer orders worth ₹59 lakh were dispatched late across 12 customers. The root cause was concentration: MS Plates came from this vendor on 17 of 17 purchase orders, with no second source.
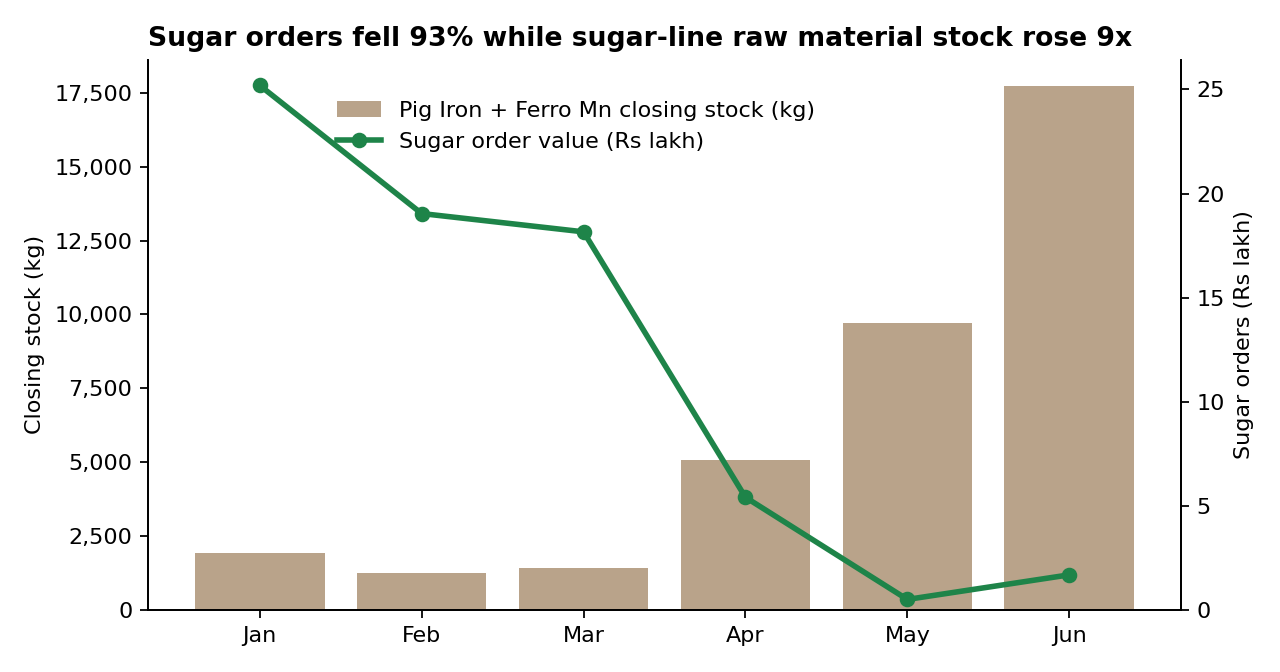
Purchasing didn't follow the sugar season down. Sugar-mill orders fell 93% as the crushing season ended, but 17 more purchase orders were placed for sugar-line raw materials. Stock rose roughly 9x, leaving ₹9 lakh of working capital tied up for six to eight months.
Input cost rises reached the price list two months late. Ferro Chrome rose 37% between January and April, while the crusher liner selling price stayed flat until April.
DATA QUALITY AUDIT
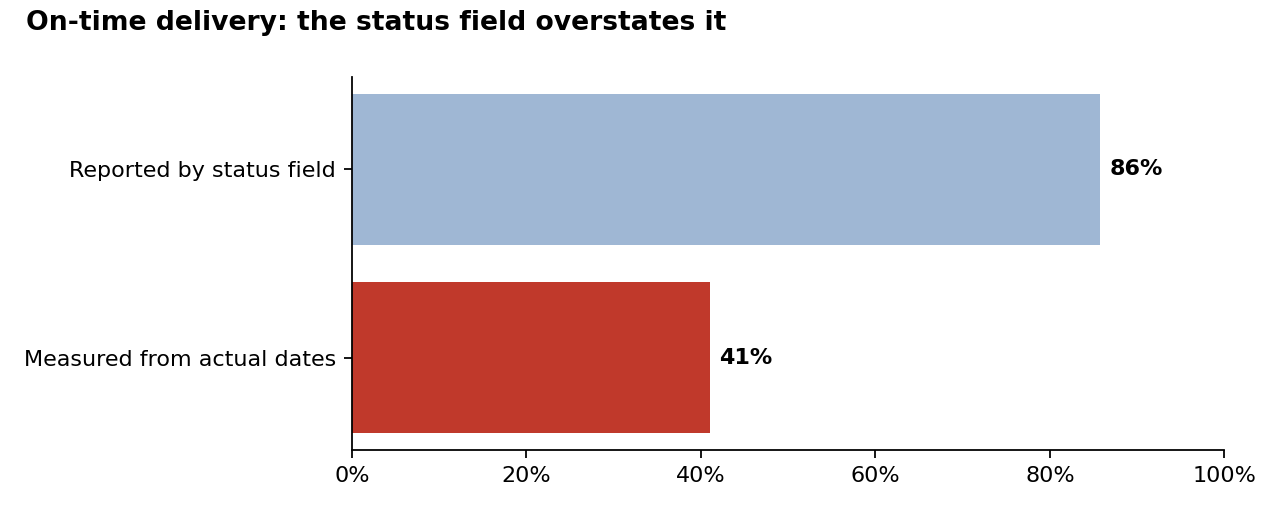
Nine checks were run before any analysis, and records were corrected rather than deleted wherever the data allowed it. The audit found six duplicate sales orders that overstated revenue by 2.1%, four customers entered under two spellings, and four ledger rows with reversed or missing quantities, recovered using the running-balance column. Most importantly, the order status field reported 86% on-time delivery when the actual dispatch dates showed 41%.
RECOMMENDATION
Qualify a second MS Plates supplier within 60 days, split volume about 70/30 once qualified, and set a reorder trigger at one month of consumption for Steel Scrap and MS Plates. Report on-time delivery from actual dispatch dates rather than the status field.
TOOLS & TECHNOLOGIES
Python | Pandas | SQL (SQLite) | Data Quality Auditing | Power BI | Matplotlib
KEY ANALYSIS VISUALIZATIONS
PROJECT REPOSITORY
The complete project, including both notebooks, the cleaned data and a full findings write-up, is available on GitHub. Company, vendor and customer names are anonymised.