
DATA PROFESSIONAL SURVEY DASHBOARD
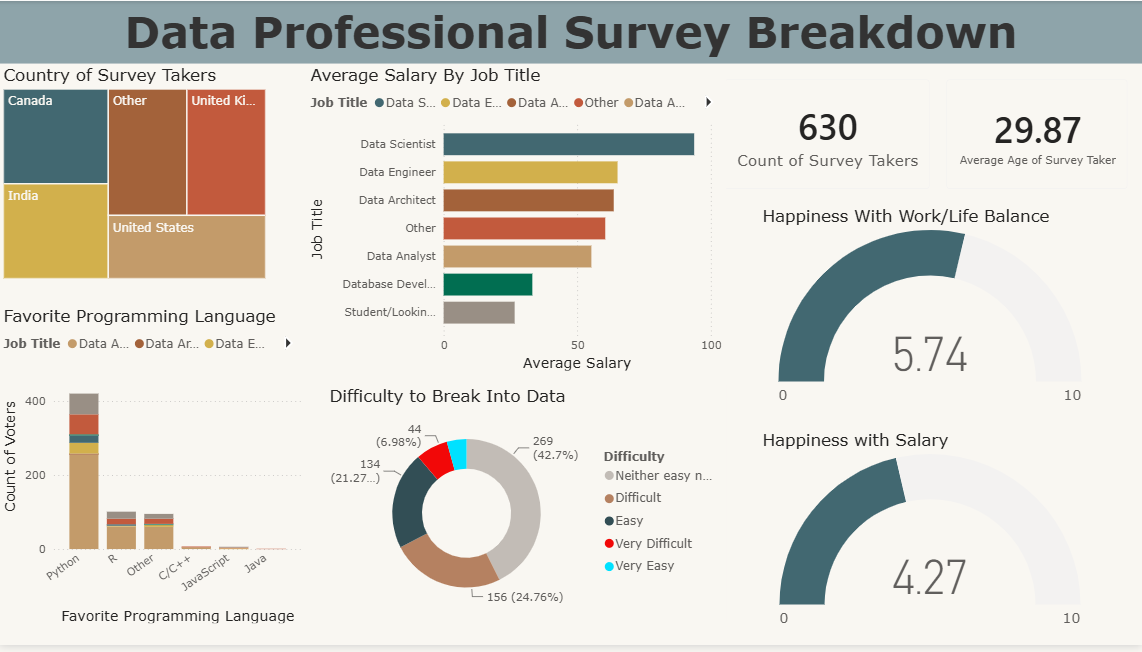
An interactive Power BI dashboard analyzing survey responses from 630 data professionals worldwide, exploring salaries, programming preferences, career difficulty and job satisfaction.
PROJECT OVERVIEW
This project analyzes survey data from 630 data professionals to understand salary trends, programming language preferences, career satisfaction and the challenges of entering the data industry.
KEY ANALYSIS
The analysis explores average salary by job title, favourite programming languages, country distribution, difficulty of breaking into data, work/life balance and salary satisfaction.
TOOLS & TECHNOLOGIES
Power BI | Power Query | DAX | Data Modelling
DASHBOARD OVERVIEW
The Power BI dashboard provides an interactive view of survey demographics, salary by role, programming language preferences, career difficulty and professional satisfaction.
KEY DASHBOARD INSIGHTS
Python is the most popular programming language among respondents, while Data Scientists have the highest average salary. Work/life balance received an average rating of 5.74/10, while salary satisfaction was rated 4.27/10.
PROJECT REPOSITORY
The complete project, including analysis and supporting files, is available on GitHub.